Engagement
Frictionless Onboarding via Industry-First Innovation
Replaced manual setup with API driven onboarding, cutting time from hours to seconds and boosting engagement 600% across the product line.
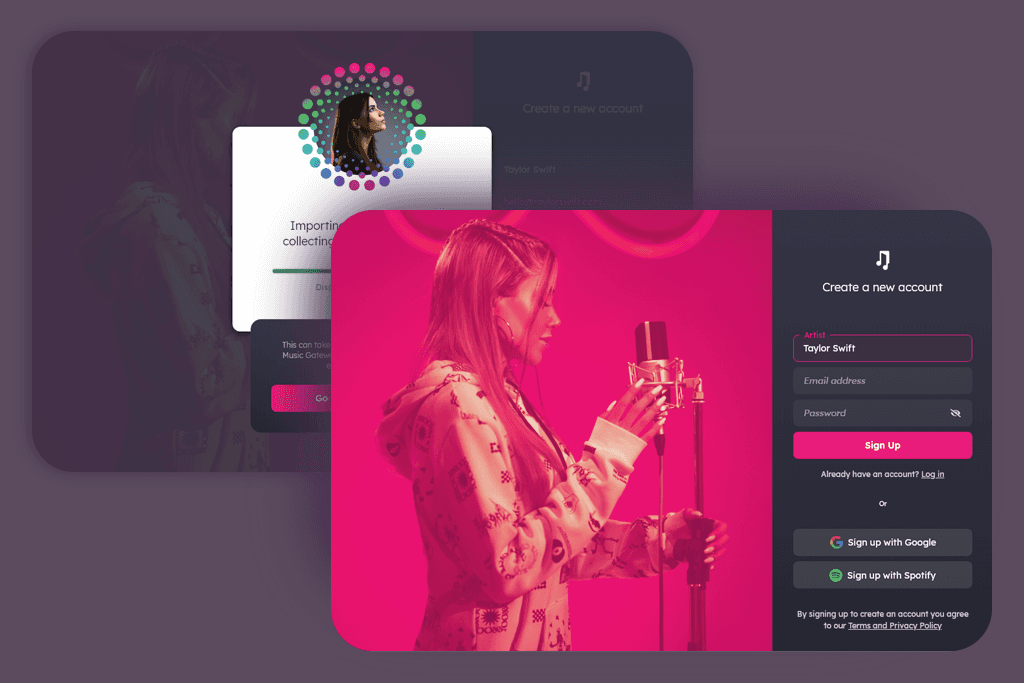
Executive summary
Designed and launched an industry-first API-driven onboarding flow that reduced setup time from hours to under 10 seconds, driving a ~600% increase in product engagement and enabling the rollout of a subscription-integrated Insights layer that contributed meaningfully to MRR growth.
📈 +600% increase in post-onboarding engagement
⚡ Setup time cut from hours → 10 seconds
💳 Boosted free-to-paid conversions during first session by 33%
🔄 30 and 90 day retention 167% increase
💡 Unlocked new “Insights” product, creating an extra revenue stream
Overview, Strategy & Execution
Business Challenge and Opportunity
The Problem:
Our multi-product SaaS platform had a strong acquisition trend (thousands of signups), but the engagement was far below expectations. Even looking at just the active users:
90% accessed only one product (typically for a single interaction in distribution or sync submissions)
10% explored additional products (publishing, promotion, mastering)
Product engagement stalled despite having 10+ integrated services
Root cause analysis revealed:
Users were interested in exploring other products but faced hours of manual data entry to list multiple songs (requiring song metadata, uploading files, taxonomy, rights information, etc.). Users deferred onboarding, but rarely returned.
The opportunity:
What if we could eliminate that onboarding friction? We would unlock massive cross-product adoption and validate our “unified platform” positioning.
Strategic Approach
Core Insight:
“What if we could pre-populate the artist and song data at signup by pulling data from services artists already use?”
Solution:
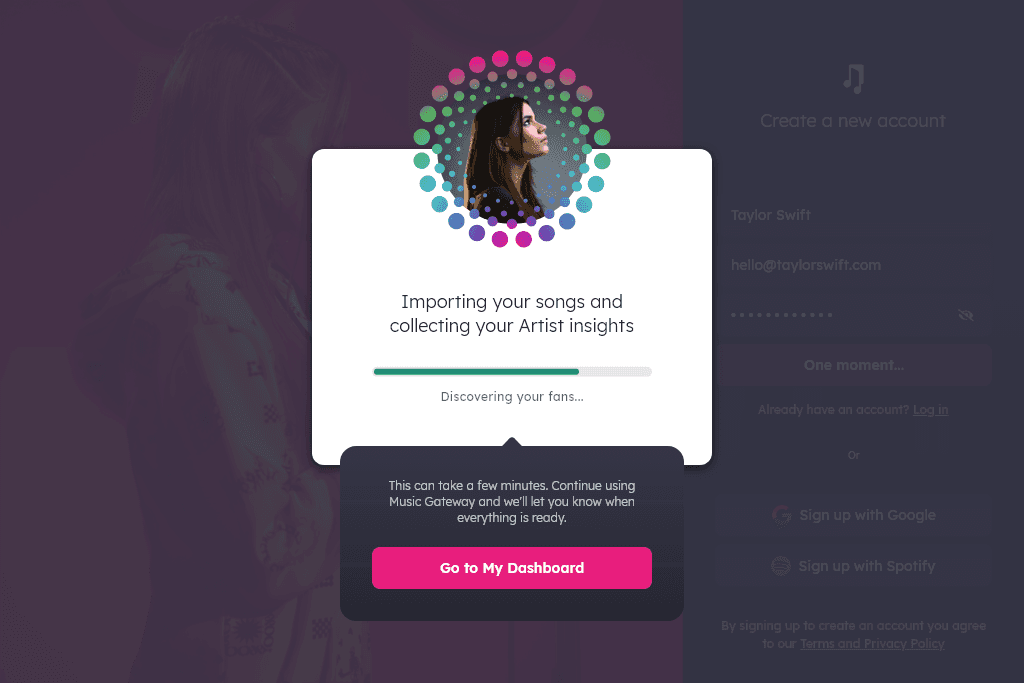
Built an industry-first API-driven “Smart” onboarding process that:
Connected to numerous third-party platforms (Spotify, Apple Music, YouTube, PROs, social media)
Aggregated artist data in real-time (catalogue, streaming stats, audience demographics, contributors)
Automatically populated artist profiles and music catalogues for use across all products
Delivered instant value on first login (“Here’s your streaming data for the last 12 months”, “This song can be submitted to playlists in one click”)
Reduced time investment:
Previously, users spent hours manually adding songs, often in batches over multiple days. Average 2-3 hours → 10 seconds (99% reduction)
Technical Leadership:
Drafted all API schemas and integration PRDs
Created graceful degradation for missing data
Worked hands-on with a 2-person engineering team on implementation
Go-to-Market:
Positioned as an industry-first innovation (no competitor had cross-platform auto-population)
Launched with an Insights product aggregating streaming, airplay, and social data (reinforcing platform differentiation)
Gallery
Case Study Deep Dive
Crisis: An Unexpected Engagement Problem
After our MVP platform launch, surface metrics looked promising:
Thousands of users signed up
The distribution product had strong adoption (our lead, mass-market product)
Sync submissions were growing (the second-largest signup driver)
Various entry points were driving product usage
But deeper analysis revealed a critically low cross-product engagement issue.
For example, a typical usage journey was to join via our distribution entry point. Below is a subset of those users who completed an action within our distribution product and a breakdown of their usage across other products.
Product | Completed an action within 30 days |
|---|---|
Distribution | 100% (entry point) |
Sync Submission | 23% |
Music Catalogue | 10% (required for other products) |
Playlist Submission | 3% |
Publishing | 2% |
Showcase | 2% |
Promotional Services | 1% (via sales team) |
The cross-product interaction was even lower when viewed from other entry points.
The pattern was clear:
Users came for one specific job (eg. release a song)
Sync submissions boosted MAU as the only “sticky” product
Fewer than 10% completed actions across multiple products
15–45% explored other products without completing actions
Only 20% completed onboarding (added at least one song)
This threatened our entire value proposition. We positioned ourselves as a unified platform, a collection of disconnected tools in one place, but users were not connecting products.
Root Cause Analysis: Diagnosing the Friction
My hypothesis framework:
Hypothesis | Validation Method | Finding |
|---|---|---|
Users don’t see value in other products | User interviews (10 users) | ❌ False - they valued the products |
UI/UX makes products hard to discover | Heatmaps, session recordings (PostHog) | ⚠️ Minor issue - discoverability was okay |
Pricing is a barrier | Pricing analysis vs competitors | ❌ False - we were competitively priced |
Onboarding friction is too high | User testing (50+ users) via session replays and user reviews (10 users) | ✅ THIS WAS IT |
The Real Problem (Validated Through User Testing):
Products relied on users providing known details, sourcing missing info, and uploading assets (creatives aren’t naturally inclined towards admin).
Known:
Song titles/album names
Contributors, producers
Genre, mood, tempo, instruments
Sourced:
ISRC, UPC, ISWC
Rights holders
Copyright splits
Lyrics
Spotify links, social media links
Assets:
Audio files
Artwork
Cover/Samples documentation
Investment time: Track: 10+ minutes. Album: 45+minutes. Catalogue: 4+ hours.
Session replay insights (watched 50+ abandonment sessions):
72% of users who started would abandon when reaching sourced or asset requirements.
The abandonment rate was exceedingly higher on the second song input, highlighting intent, but friction at data entry.
Common behaviour included leaving the page to find data, returning without it and then abandoning when it became a blocker.
User interviews highlighted:
Intent to return at a later date to add more (never doing so).
Certain information, such as ISRC, UPC, links, splits and artwork, was not available locally or even known.
The repetitive nature became boring.
The thought of having to do something multiple times over was a negative
Time was an issue. The interest was there, but after spending time finding and filling out information, the interest waned.
The insight: The issue wasn’t motivation, it was friction. Repetition, sourcing gaps, and time cost eroded intent.
Strategic Approach: Designing the Solution
We'd always known data was key for our platform, but priority was initially given to the MVP. With the engagement problem now clearly identified, we were able to revisit exactly what "data is key" meant. Now we had our new focus: How do we use known data to improve the onboarding process and ultimately improve cross-product usage?
My strategic insight: If we tap into existing APIs, we can surface artist information automatically instead of making users enter everything manually.
The API landscape I evaluated
Individual Platform APIs Available:
Spotify (existing partnership, free access via public API)
Apple Music (limited public data, deprioritised)
Amazon Music (limited API, deprioritised)
SoundCloud (open API, less reliable data)
YouTube (public data via Google API)
Data Aggregator Options:
Soundcharts (chosen for 500,000 requests at $250, comprehensive airplay data, social interactions, streaming analytics)
ChartMetric (competitor to Soundcharts, similar pricing)
MusicBrainz (open data, limited commercial use)
The cost challenge: Soundcharts provided the richest dataset at a reasonable cost (500K requests = $0.0005 per call), but we still needed to manage call frequency as each artist would require many calls per ingestion. This was manageable for paying users (we could absorb the cost in subscription pricing), but we had a large base of free users, many of whom would bounce before any meaningful interaction and couldn't justify ongoing API costs for users who might never convert.
My Solution: Tiered Data Fetching Strategy
Tier 1: Free Data (Signup - Immediate)
Pull from Spotify public API only (free, no authentication required)
Fetch: Artist name, basic catalogue (song titles, album names), low-resolution artwork
Spelling correction built in: Spotify API returns similar artist matches if the name is misspelt
Purpose: Create an instant profile that looks complete without pulling the full dataset
Tier 2: On-Demand Data (User Engagement - Triggered)
When the user interacts with a product or song (e.g., submits to a playlist, enables publishing, views Insights)
Then fetch full data from Soundcharts (detailed song data, streaming stats, social metrics, airplay data)
Justification: User has shown intent → can tie API costs to cost-per-acquisition for that user
Tier 3: Staggered Ingestion (Background - Post-Signup)
After initial profile creation, background jobs progressively fetch additional data
20-60 minutes post-signup, the full catalogue ingestion is complete
Follow-up email sent containing insights (engagement hook)
Why this worked:
Instant gratification: Users saw a populated profile in 30 seconds (even if not fully complete)
Cost control: Soundcharts calls are only made when the user demonstrates intent (engaged with the platform)
Perception vs reality: Profile appeared complete immediately, full data filled in progressively
Fallback Strategy (No Data Found):
If Spotify API returned no results:
Spelling correction: Spotify API suggests similar artist names ("Did you mean: [Artist Name]?")
Multiple matches: If Spotify returns multiple artists with the same/similar names, present disambiguation UI ("Which one is you?")
Trigger aggregator search: Send artist details to Soundcharts for broader search
Manual entry fallback: If no match is found, the user must manually add songs individually.
Follow-up process: Background job retries Spotify search 24 hours later (in case of temporary API issues or newly added artists)
Solution Design: Instant Onboarding
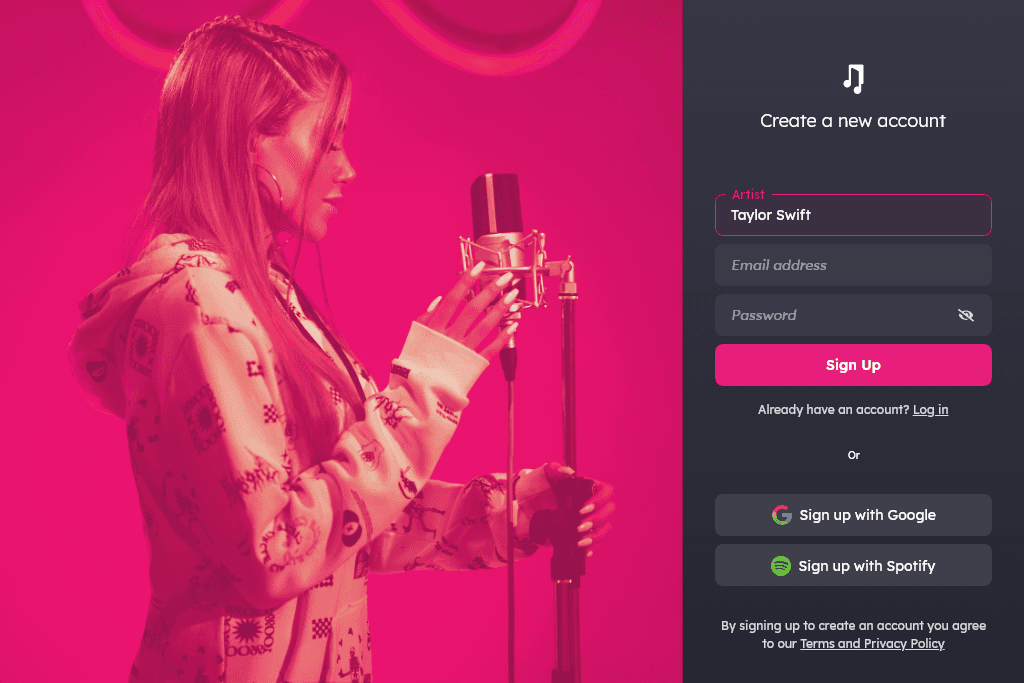
Step 1: Artist Name Pre-Qualifier (Signup Screen)
At signup, we ask for the artist's name (before email/password). This served two strategic purposes:
Purpose 1: User Pre-Qualification
Filters out non-artist signups (we cast a wide net with marketing, media buyers, fans, playlisters, etc.)
Only users with artist names proceed (natural filtering without explicit rejection and taking them down a different route)
Purpose 2: Background Processing Delay
While the user enters email/password/profile details, the background job fetches data
By the time the user completes the signup, their profile is already populated
User never sees a loading screen, and data appears instantly on first login
Step 2: Data Aggregation (Background Process)
What we fetched automatically:
Data Type | Source | Purpose |
|---|---|---|
Song catalogue | Spotify API | Pre-populate music catalogue, enable one-click distribution |
Album metadata | Spotify API | Complete discography, artwork, release dates |
Low-res artwork | Spotify API (thumbnail URLs) | Fast-loading profile images |
Basic streaming stats | Spotify API (public data) | Show "You have X monthly listeners" |
Social links | Spotify API (bio, external URLs) | Pre-fill social media connections |
What we fetched on-demand (when the user engaged):
Trigger | Data Fetched | Source |
|---|---|---|
User clicks "Insights" product | Full streaming analytics, airplay data, playlist additions | ChartMetric (paid) |
User submits song to playlist | Playlist performance history, genre fit analysis | ChartMetric (paid) |
User enters song process flow for any product | Songwriting credits, PRO affiliations, royalty estimates | ChartMetric + PRO APIs |
Step 3: Progressive Enrichment (Post-Signup, 20-60 Mins)
Background jobs continued fetching:
Full-resolution artwork (high-quality images for showcase pages and distribution)
Historical streaming data (12-month trends, not just current stats)
Social media followers, posts, interactions, reach, etc. (Facebook, Instagram, TikTok, YouTube via APIs)
Playlist placements (which playlists feature the artist's songs)
Airplay and charts (country, global, platform)
Follow-up email (sent 24 hours post-ingestion):
Import updates
Key engagement stats
Engagement drivers for paid elements
Why the 24-hour delay worked:
Re-engagement hook: Brings users back to the platform (combat day 2 churn, which was the highest churn point)
Shows ongoing value: Working for them on their behalf (platform feels active, not static)
Upsell opportunity: Insights data in the email teases paid-for stats
The Value Unlocked (Cross-Product Impact):
1. Music Catalogue Product (Core Hub)
Pre-populated with songs, albums, metadata
Became a central hub for all downstream products (distribution, sync, showcase, playlist submission)
2. Distribution Product
Songs already in catalogue → one-click rerelease
Pre-populated song data → No manual entry
Historical release data imported → users saw the complete discography
3. Publishing Product
Streaming data → estimated uncollected royalties
Songwriting credits pulled from metadata → pre-filled PRO
4. Sync Submission
Songs pre-qualified based on genre, mood, tempo (pulled from Spotify metadata)
One-click sync submission (no manual tagging required)
5. Playlist Submission
Playlist performance data → Songs identified for playlists (recommendations based on API data)
One-click submission (pre-filled with song info)
6. Showcase Product (Auto-Generated)
Artist bio (from Spotify), discography, artwork, social links → auto-generated public profile
Additional SEO strategy: We created showcase pages for major artists (public figures) using publicly available data
Ranked for artist names, drove organic traffic
7. Artist Insights Product (NEW - Unlocked by Data Aggregation)
The strategic unlock: By aggregating data from Spotify and Soundcharts, we had a unique cross-platform dataset that could be offset by acquisition costs to offer the product for free.
What Insights were offered:
Free Tier (Teaser - Drive Upgrades):
Current streaming stats: Monthly listeners, follower count (Spotify only)
Top 3 songs: breakdowns by platform, audience, etc.
Basic audience demographics: Partial visibility and limited time span
Purpose: Give users enough value to see potential, create desire for more
Paid Tier (Credits or Subscription):
Cross-platform analytics: Spotify + Apple Music + YouTube streams + more in one dashboard
Trend analysis: Which songs are growing/declining, which platforms are driving engagement
Full audience insights: Demographics, geography, listening behaviour across all platforms
Competitive benchmarking: Compared against other users on Music Gateway, more comparative for newer artists than being compared against established artists
Playlist tracking: Which playlists added/removed your songs, impact on streams
Airplay data: Radio play tracking (from Soundcharts), chart data
Social metrics: Follower growth and engagement, potential outreach opportunities, etc.
Monetisation Model:
Not a standalone product (no separate monthly pricing)
Integrated into subscription: paid subscriptions included full Insights access
Credit-based access: Free users could spend credits to unlock Insights and refreshed data
Freemium teaser: Free tier showed just enough to create upgrade desire
Outcome:
Became the third revenue generator (after distribution and sync)
Drove subscription upgrades (users cited Insights as key reason for upgrading in surveys)
Credit spending increased (Insights was popular credit spend, alongside playlist submission)
Time Investment Comparison:
Task | Before Instant Onboarding | After Instant Onboarding |
|---|---|---|
Enter song catalogue | 10–15 min per song × 20 songs = 3–4 hours | 0 seconds (auto-imported) |
Fill out artist showcase | 10–20 min | 0 seconds (pulled from APIs) |
Total onboarding time | 2–4 hours | 10 seconds |
Reduction | -- | 99%+ |
Technical Architecture (I Designed and Documented)
API Integration Layer:
I drafted the technical specifications for all API integrations, including:
Data flow diagrams: How data moves from external APIs → our database → user profile
Fallback logic: What happens when APIs fail, and how to gracefully degrade
Cost management: When to use free APIs vs paid APIs and how to optimise call frequency
User flow documentation: How users experience data population and what they see when
Integration specifications I wrote
Spotify Public API (Free Tier):
Soundcharts API (Paid Tier - On-Demand Only):
Technical Challenges & Solutions:
Challenge | Solution I Designed | Implementation Details |
|---|---|---|
API rate limits | Queuing system with exponential backoff | Built job queue processing API calls over 60-second window; retry logic with 1h, 1d, 2d delays; fallback to manual entry if APIs fail after 3 retries |
Inconsistent data formats | Canonical data model + mapping layer | Documented 50+ field mappings per platform; built transformation functions; handled missing fields gracefully |
Cost control (Soundcharts paid calls) | Tiered fetching strategy | Free tier: Spotify public API only; Paid tier or high-intent users: Soundcharts calls; Cost tracked per user (~$0.0005 per call), factored into CAC/LTV models |
Artist name disambiguation | Spotify spelling correction + manual selection | Spotify API suggests similar names if misspelt; presents multiple matches if ambiguous ("Which artist are you?"); User selects correct match |
Failed API calls (inevitable) | Graceful degradation + fallback | Show what we successfully imported; Prompt user to manually add missing songs; Never block user progress (partial data better than no data) |
Data freshness | Incremental updates + refresh mechanism | Initial import on signup; Manual refresh button tied to credit use and subscription (free users: limited refreshes, paid users: frequent refreshes); Cached data for speed (7-day TTL for most data, 24-hour for time-sensitive stats) |
Go-to-Market Strategy
Before building, I needed to convince stakeholders that this was worth 2-4 months of engineering, design and marketing time.
Investment:
Engineering time: 3 months (2 engineers × 50% capacity = ~480 engineering hours)
API costs: £250/month estimated (free tiers, paid plans)
Opportunity cost: Delayed other feature improvements (acceptable trade-off)
Expected Return:
Engagement lift: Conservative estimate 2-3× (based on reducing friction and having songs instantly available to use in products)
Retention lift: Conservative estimate +20% (users who engage more, stay longer)
Conversion lift: Conservative estimate +25% (engaged users convert at higher rates)
Strategic value: Industry-first positioning, press coverage, competitive moat
CEO and stakeholder approval ✅
Launch Strategy
Positioning:
Name: “Instant Onboarding” (clear, benefit-driven, memorable)
Tagline: “All your music, all your fans and all your insights. In an instant.”
Messaging framework:
Problem: “Adding your songs to a new platform takes ages.”
Solution: “We’ll import everything automatically.”
Benefit: “You do the music. We do the admin.”
Proof: “Every song. Every play. Every fan. Join thousands of artists who are instantly accessing their insights with a single click”
Launch Tactics
Existing user migration
Emailed all active users, letting them know we’ve imported all their songs, streams and fans across social media
Incentive: Stats on artists and songs teased
Result: Highest engagement rate from an email ever (proving stats email drives interest)
New user onboarding
Made Instant Onboarding the default signup flow
Marketing and PR
Press release: Industry-First Instant Onboarding
Marketing site updates: Promoting the process and insights product
SEO marketing: Positioned new product against competitors, outreach
Social media campaigns: Building product and process awareness and hype
Result: Marketing push positioned the process and product as category-defining, drove lift in organic traffic, 3,000+ new signups and reduced CAC during the campaign.
The Impact: Quantified Results
Primary Metrics:
Metric | Before Instant Onboarding | After Instant Onboarding | Change |
|---|---|---|---|
Onboarding completion rate | 20% | 78% | +290% |
Users accessing 2 products | 10% | 65% | +550% |
Users accessing 3+ products | 5% | 37% | +640% |
Monthly active users (MAU) | 1.0× (baseline) | 1.9× | +90% |
Actions per session | 1.2 | 3.7 | +208% |
How “~600% engagement” was calculated:
Combining the average of users who accessed 2 and 3+ products.
(550% + 640%) / 2 = 595%
Rounded up to a clean number.
Zooming out and looking at platform-wide engagement, we can see that if evenly weighted, engagement increased by 356%; however, due to the nature of the platform, usage across products is far more indicative of product engagement than session-level activity.
Retention & Conversion:
Metric | Before | After | Change |
|---|---|---|---|
30-day retention | 20% | 30% | +50% |
90-day retention | 3% | 8% | +167% |
Free-to-paid conversion (all users) | 3% | 3.2% | +7% |
Free-to-paid conversion (Instant Onboarding users) | Baseline | 4% | +33% |
Time to first paid conversion | 14 days avg | 10 days avg | -29% |
Strategic Unlocks: New Emergent Products
Insights Product
The opportunity: By aggregating data from Spotify, Apple, YouTube, PROs, and social platforms, we had a unique cross-platform dataset that no competitor was collecting and offering to their users.
What we built:
Cross-platform analytics: An all-in-one dashboard, total streams, airplay, playlists and audiences
Trend analysis: Which songs are growing/declining, which platforms drive the most engagement
Audience insights: Demographics (age, gender, location), followers, growth and outreach insights
Competitive benchmarking: Comparing Music Gateway users with each other
Data limits: A driver for upgrades and increasing “sticky“ product offering
Results:
Increase in subscription and credit spend
Became a key sales differentiator
Retention impact: Users with Insights had a higher retention (data creates stickiness and email marketing included personal stats)
Showcase Auto-Generation & SEO Strategy
The opportunity: Instant Onboarding aggregated rich artist data (bio, discography, streaming stats, social links). We could use this to auto-generate artist showcase pages with zero user effort.
SEO strategy:
Ranking for artist names. Generated high-profile artist pages to rank for their name keywords (potential future fan-focused product).
What we built:
Auto-generated showcase pages for logged-in users (pulled from Instant Onboarding data)
Public showcase pages for 1000s of major artists (scraped public Spotify/YouTube data)
SEO-optimised (artist name in title, meta description, schema markup)
Dynamic content (latest releases, streaming stats, tour dates, etc.)
Results:
Ranked page 1 on Google for 100s of artist names
Constant flow of fresh content
Repositioned showcases as “link-in-bios” and targeted a new revenue-generating stream
Competitive Moat
What happened after we launched:
To date, no other direct competitor has replicated this process
Over time, indirect competitors (publishers) began onboarding through Spotify APIs only
Promotional Services Conversion Lift
Strategic insight: Instant Onboarding surfaced high-quality leads for our sales team.
Sales qualification signals we tracked:
Signal | What It Means | How We Used It |
|---|---|---|
Recently released songs | Artist is actively releasing → needs promotion | Sales team reached out within 48 hours of release |
Growing streaming numbers | Artist has momentum → good ROI candidate | Prioritised outreach (higher close rate) |
Complete profile | Artist is engaged → more likely to convert | Scored leads by profile completeness |
Release cadence | Release date analysis → predict next release | Target leads with releases likely to be approaching |
Genre + audience size | Targeting fit for our promotional partners | Matched artists to relevant campaigns |
Results:
No cost per acquisition (CPA) lowered the average CPA
Surfaced leads that would have never existed otherwise
Larger than average deal size for targeted users
Improved customer satisfaction through data-led proactive actions
Reflection
Friction Removal is Better Than Feature Addition
Instant Onboarding didn’t add new capabilities; it removed barriers to existing ones.
Strategic lesson: In mature markets, removing friction often delivers more value than adding features. Users don’t want more tools; they want existing tools to work effortlessly.
Application to future roles: Look for “hidden friction” in onboarding, authentication, data entry, and account setup.
Integration as a Competitive Moat
API integration gives the product a clear advantage over competitors.
Strategic lesson: Integrations are underrated as moats. They’re technically complex, require partnerships, and create compounding value (each new integration makes the product stickier).
Application to future roles: Prioritise integrations early. API-first architecture enables future innovation (we unlocked the Insights product because we had the data infrastructure).
Data Aggregation Can Unlock New Products
Instant Onboarding was built to solve onboarding friction, but the aggregated data became the foundation for multiple new revenue drivers (including the Insights product and showcase as a link-in-bio product).
Strategic lesson: Data aggregation has compounding returns. What starts as utility (pre-fill forms) becomes a strategic asset (unique dataset → new products).
Application to future roles: Consider beyond the immediate use case when building integrations. Design data architecture for future optionality.
AI-Forward
Instant Onboarding was pre-AI, but as an exercise, this is how AI could improve products and processes further:
Current Solution | AI-Forward Improvement |
|---|---|
Auto-import song metadata | AI-generated song tags (genre, mood, instruments) from audio analysis to complete song data to 100% |
Manual entry of lyrics and language | AI-generated lyrics and language detection to improve sections often left blank and to help with Sync topic searching |
Pre-populate artist bio from Spotify | AI-generated artist bio from aggregated press, social posts, streaming data |
Show streaming stats dashboard | Conversational AI-generated insights, with access to ask questions and query data |
One-click playlist submission | AI-recommended playlists based on song analysis, audience overlap, historical acceptance rates |
Manual promotional services outreach | AI-generated promotional strategies for all artists based on their release cadence, usage and data |
Artists surfaced to the promo and sales team through query lookups | AI-prompted suggestions based on key indicators so that promo and sales can quickly understand the nuance of the data |
Business Impact
📈 Engagement Surge:
2 products: 10% → 65% (+550%)
3+ products: 5% → 37% (+640%)
Overall engagement: ~600% increase, reflecting deeper multi-product adoption and sustained usage.
🎯 Retention & Conversion:
Onboarding completion: 20% → 78% (+290%)
30-day retention: 20% → 30% (+50%)
90-day retention: 3% → 8% (+167%)
Free-to-paid conversion: 3% → 4% (+33%)
💡 Strategic Unlock:
The new Insights product drove credit usage and subscription value
SEO strategy auto-generated artist showcase pages (often ranking on page 1)
Competitive moat: No replication to date; only Sentric introduced a limited Spotify import, validating unmet demand
Conclusion
This wasn’t a UX design project. It was a strategic product innovation that:
Diagnosed a critical engagement problem (90% single-product usage) through data analysis
Identified root cause (hours of manual setup) via user research and session replays
Designed an industry-first solution (API-driven auto-population) that no competitor had built
Led technical integration by drafting all API schemas, flows and logic
Executed cross-functional launch in product, engineering, marketing and sales alignment
Drove measurable business impact (including ~600% engagement increase and +90% MAU growth)
My role: Owned problem diagnosis, solution design, technical architecture, go-to-market strategy, and outcome measurement. Drafted all API requirements, worked hands-on with engineering, aligned sales and marketing, and reported results to the CEO/stakeholders.
Impact drivers
✅ Strategic diagnosis
✅ Technical depth
✅ Cross-functional leadership
✅ Business impact
✅ Product innovation
✅ Data-driven opportunity identification
✅ Outcome-oriented execution
More case studies
Hire Me
Ready to discuss how strategic product leadership can drive your business goals? Then let's get in touch.